
ITP6 Ltd · market-analysis software and structured learning
Software for reading price, and a course that teaches the reading
ITP6 publishes a charting workspace, a twelve-study indicator library and six learning modules. Decisions stay with you. The platform does not place orders, and nothing on this site is investment advice.
- Software & education only
- No investment advice
- Licensed market data
- Cancel anytime
Scope
A software and education company, and nothing else
ITP6 Ltd is registered in England (company number 16650548) and works from Leicester. The company builds market-analysis software and writes the learning material that goes with it. That is the whole of the business.
What we provide
- A charting workspace with zones, studies and a journalling layer
- Six written modules, each with practice datasets
- Documented data handling: adjustment, timezones, gaps, backfill
- Subscription tiers that can be cancelled at the end of any paid month
What we do not provide
- Personal recommendations or portfolio management
- Order routing, execution or custody of any kind
- Signals, copy trading or managed accounts
- Any statement about future returns, ours or yours
The workspace
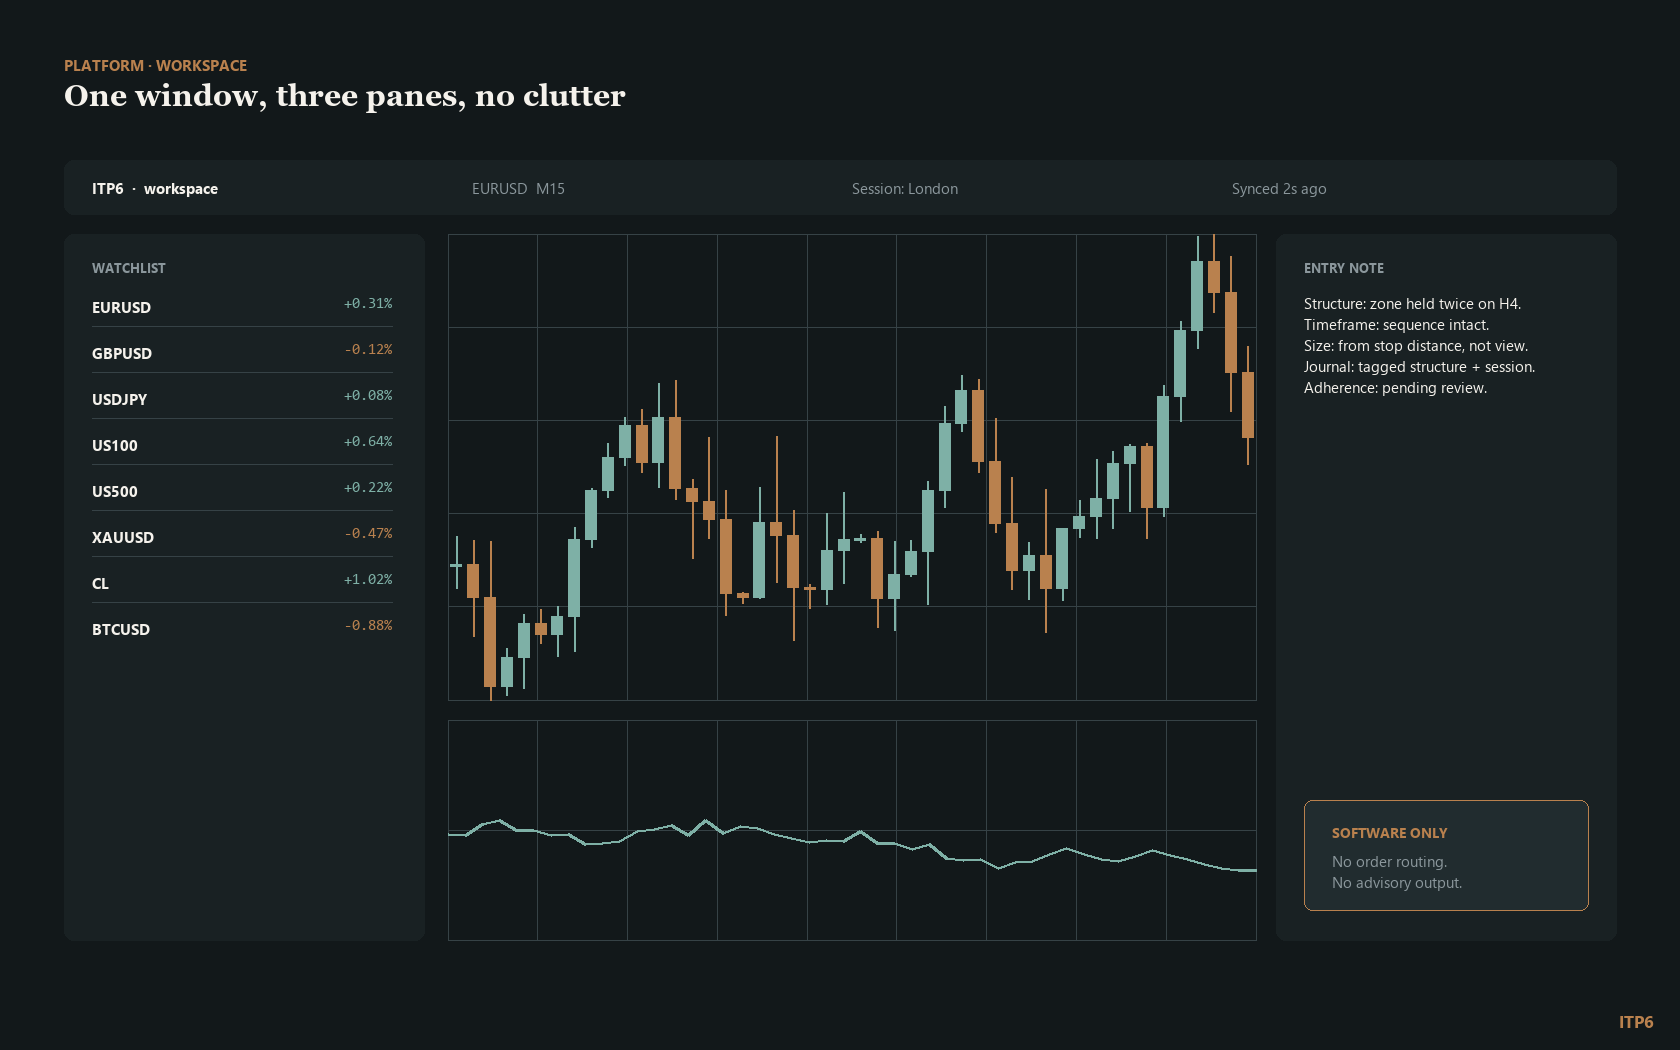
One window, three panes, no clutter
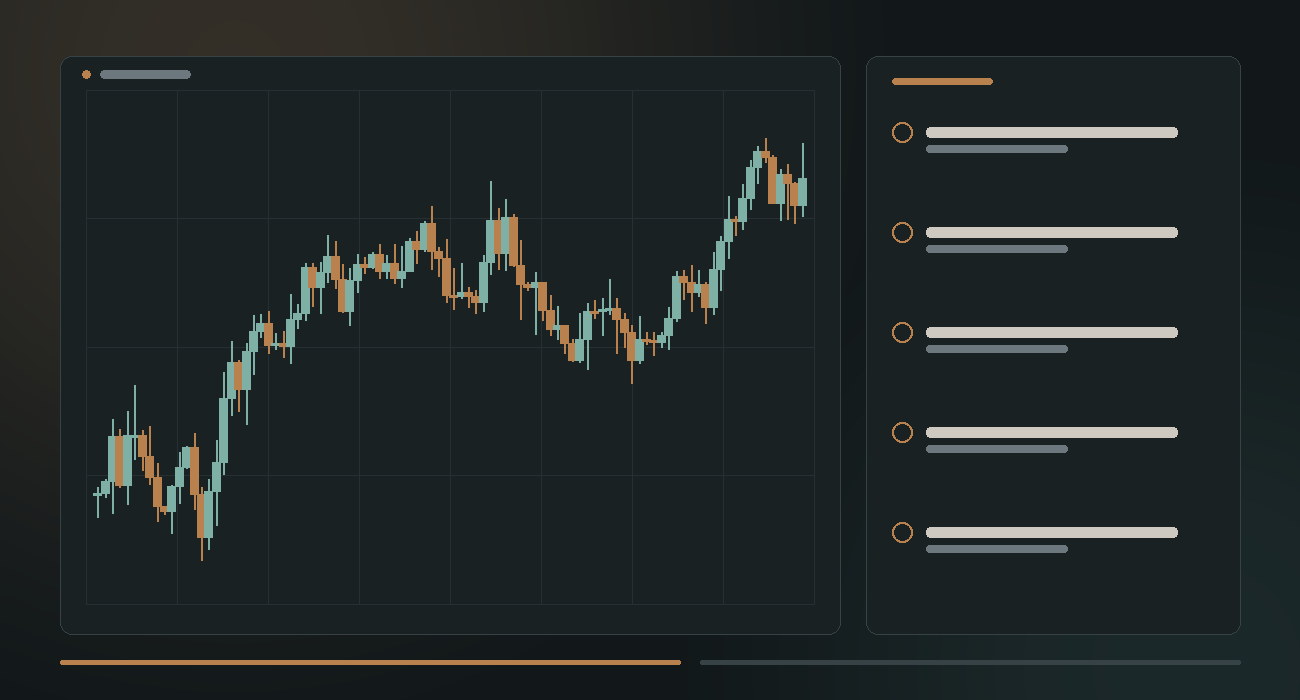
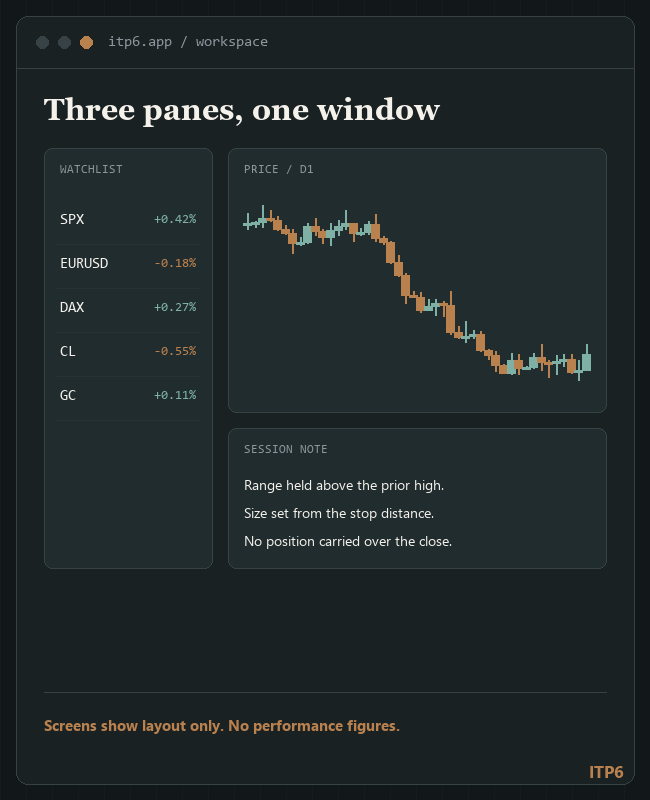
A watchlist on the left, the price panel in the middle, the note you are writing on the right. Everything else is a panel you switched on deliberately. The layout is saved per account, not per browser.
Watchlist
Eight instruments by default, grouped by the sessions in which they actually trade.
Price panel
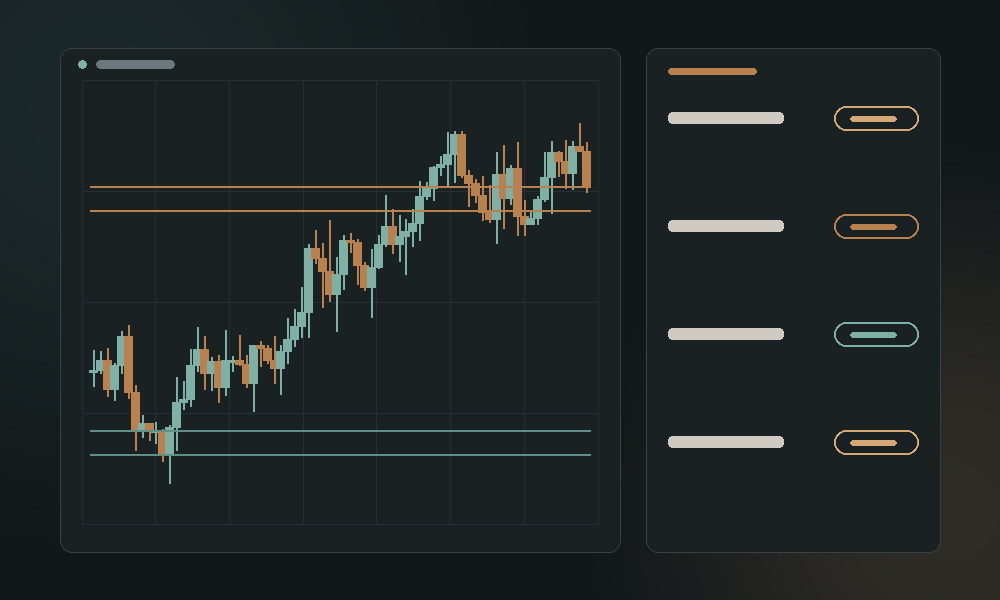
Zones, studies and an overlay or sub-panel decision you make once and keep.
Entry note
The journal entry opens beside the chart, so the reasoning is written while it is still visible.
Education
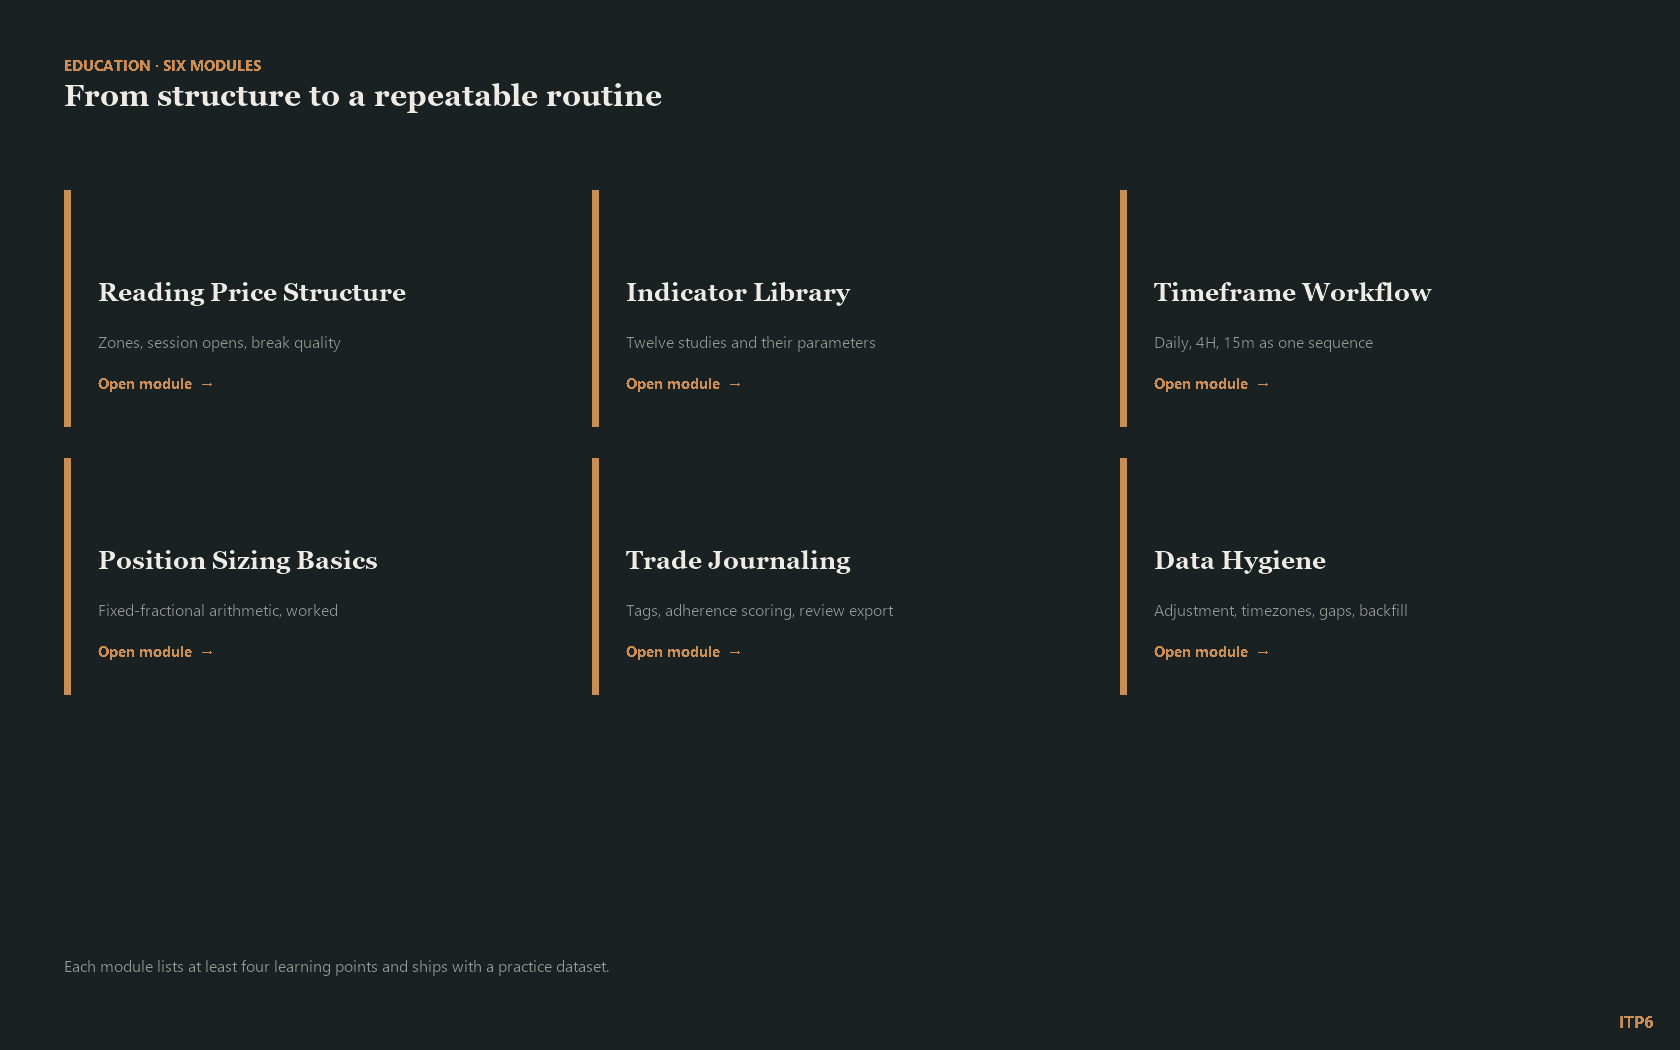
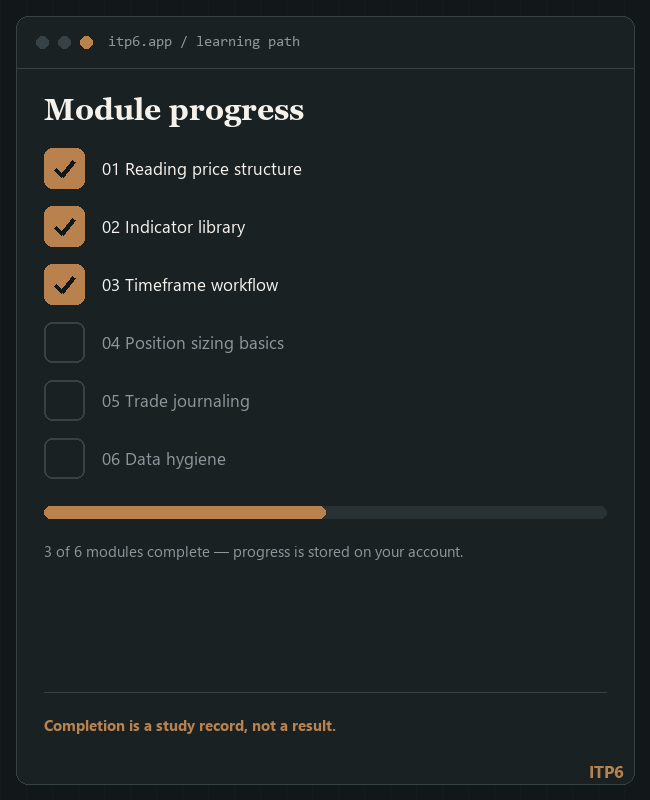
Six modules that take you from price structure to a written routine
Each module lists at least four learning points and ships with practice data. They are written to be worked through in order, though nothing stops you starting at the one you need.
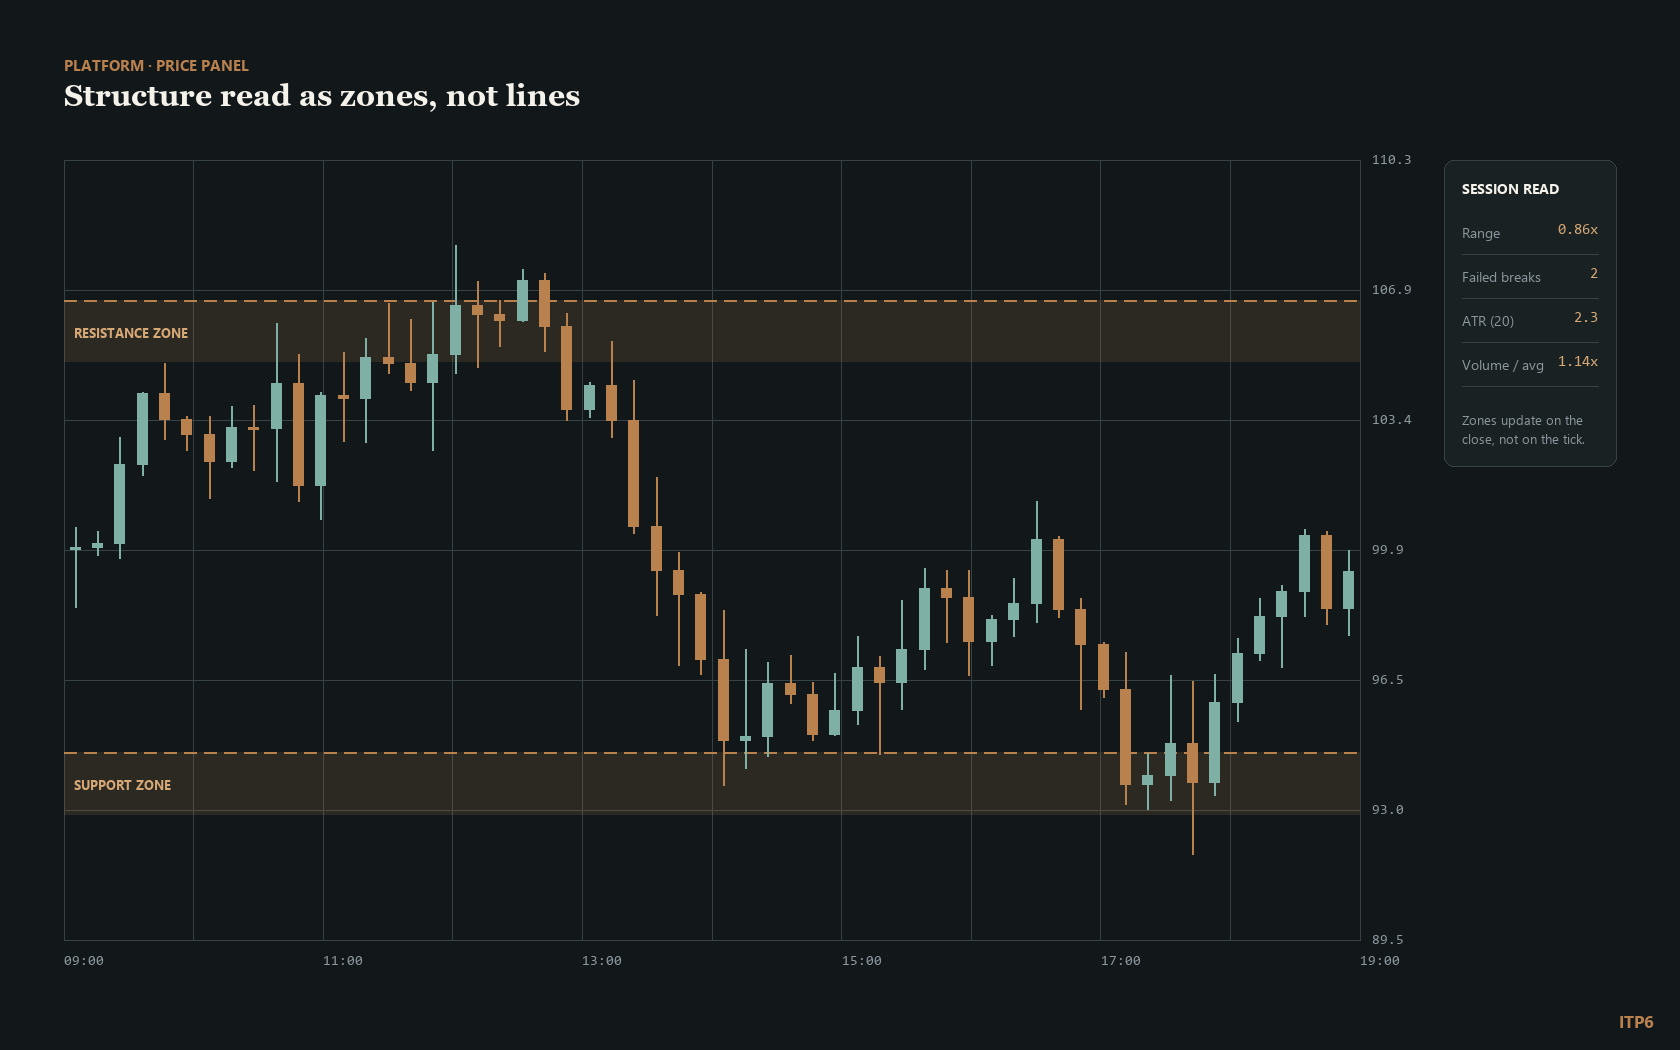
Reading Price Structure
Support and resistance treated as zones rather than lines, with the rules for deciding when a zone has failed.
- Zones drawn from swing clusters, not single touches
- Session opens and the first hour range
- Range expansion versus contraction reads
- Failed breaks and how they are logged
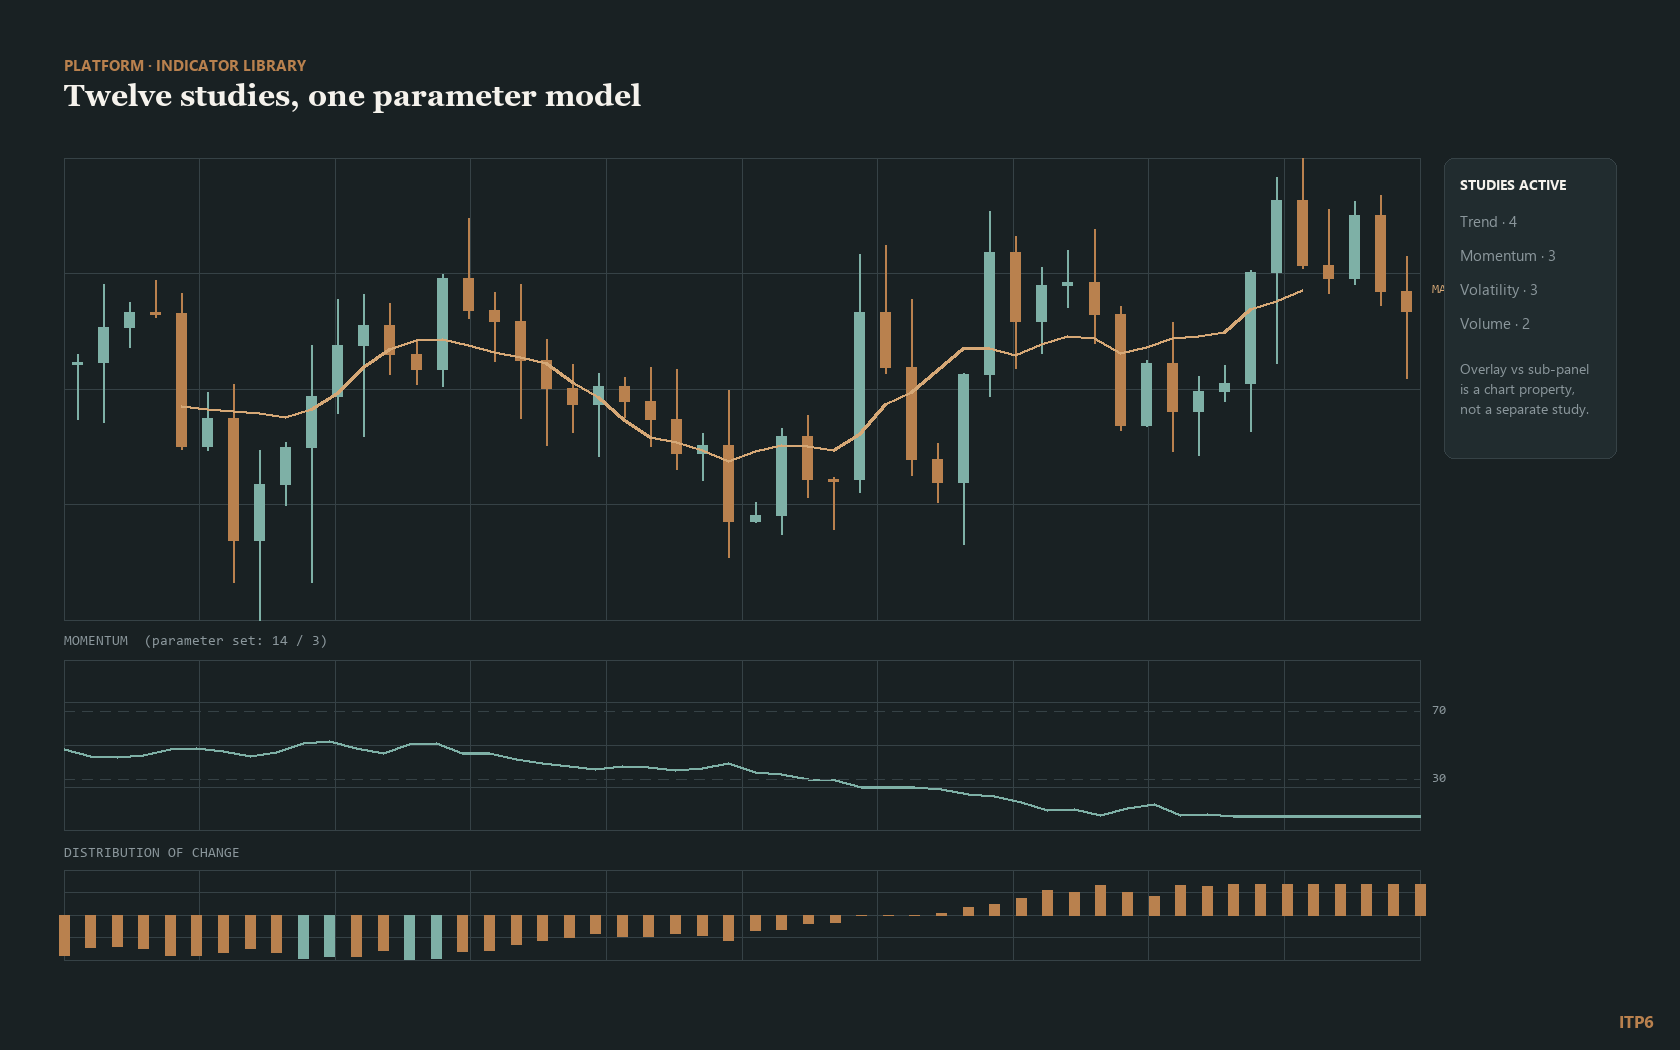
Indicator Library
Twelve built-in studies across trend, momentum and volatility, each with a documented parameter model.
- Twelve studies, three families
- Parameter presets you can duplicate
- Custom moving-average lengths
- Overlay versus sub-panel placement
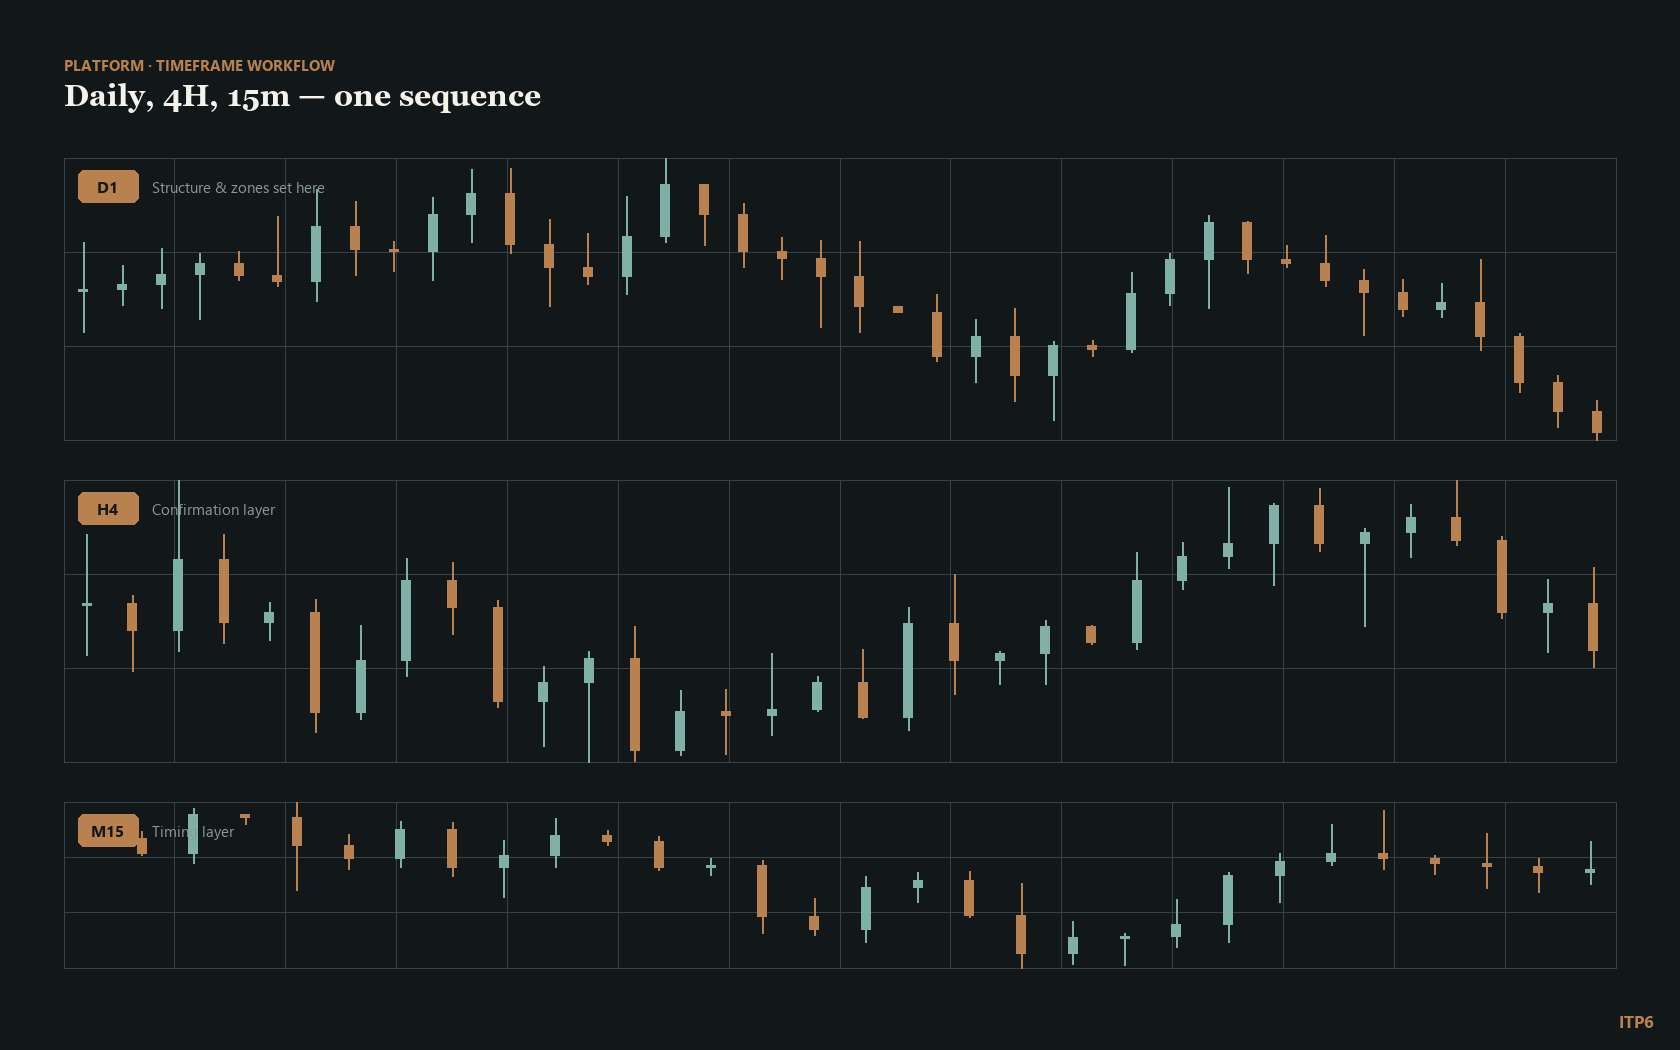
Timeframe Workflow
A top-down sequence that keeps one narrative across three timeframe groups instead of five competing charts.
- Daily, four-hour and fifteen-minute groups
- Structure set on the highest timeframe first
- Multi-timeframe alert conditions
- Session-aware chart boundaries
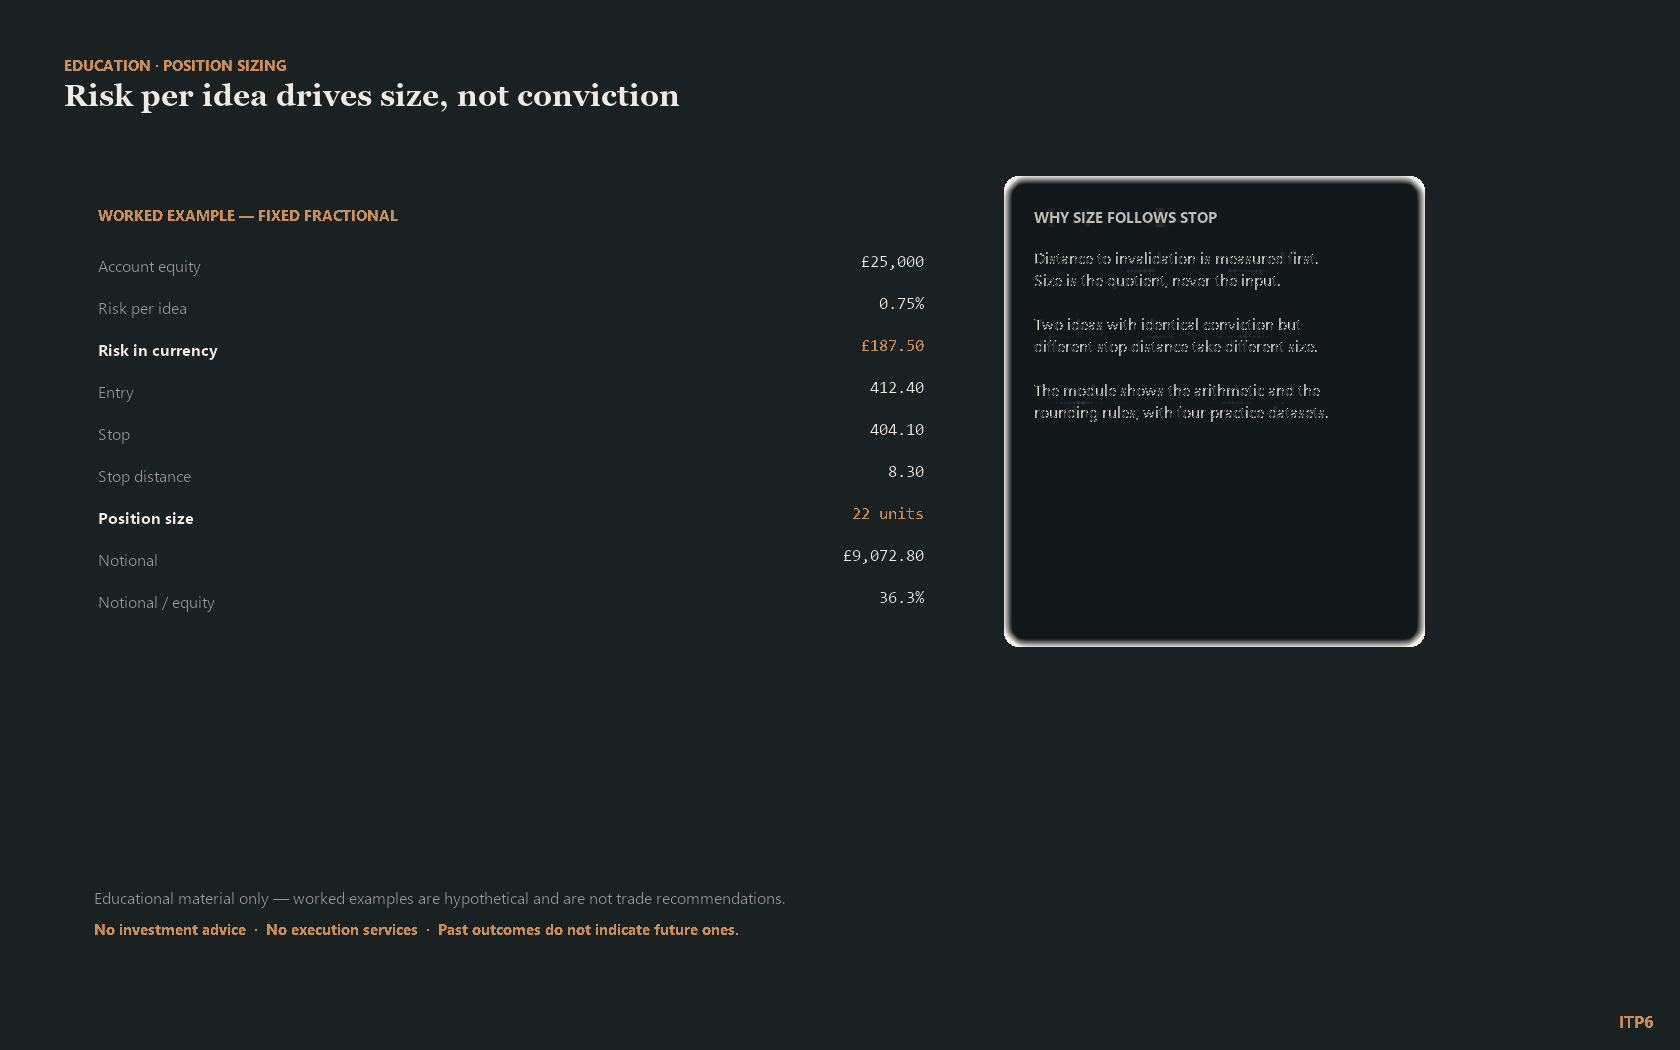
Position Sizing Basics
Fixed-fractional arithmetic worked through end to end, so that size follows the stop rather than conviction.
- Risk per idea stated as a percentage
- Stop distance to position size
- Rounding and minimum lot rules
- Four worked examples with different stops
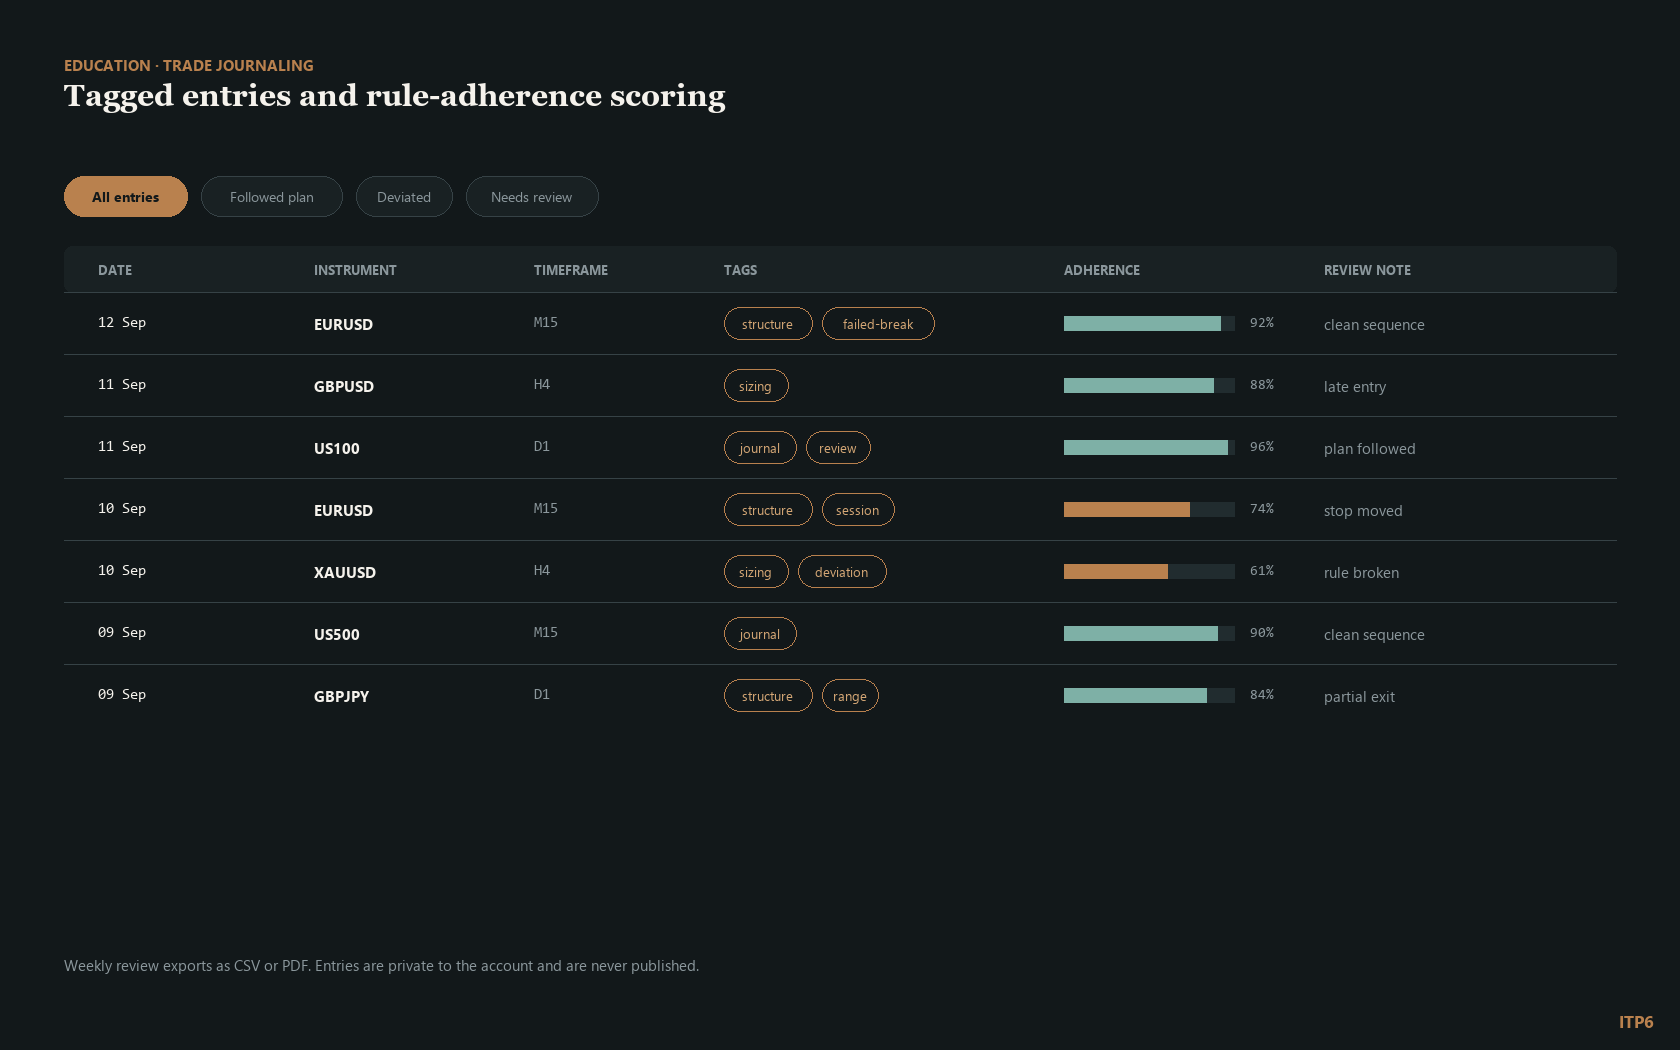
Trade Journaling
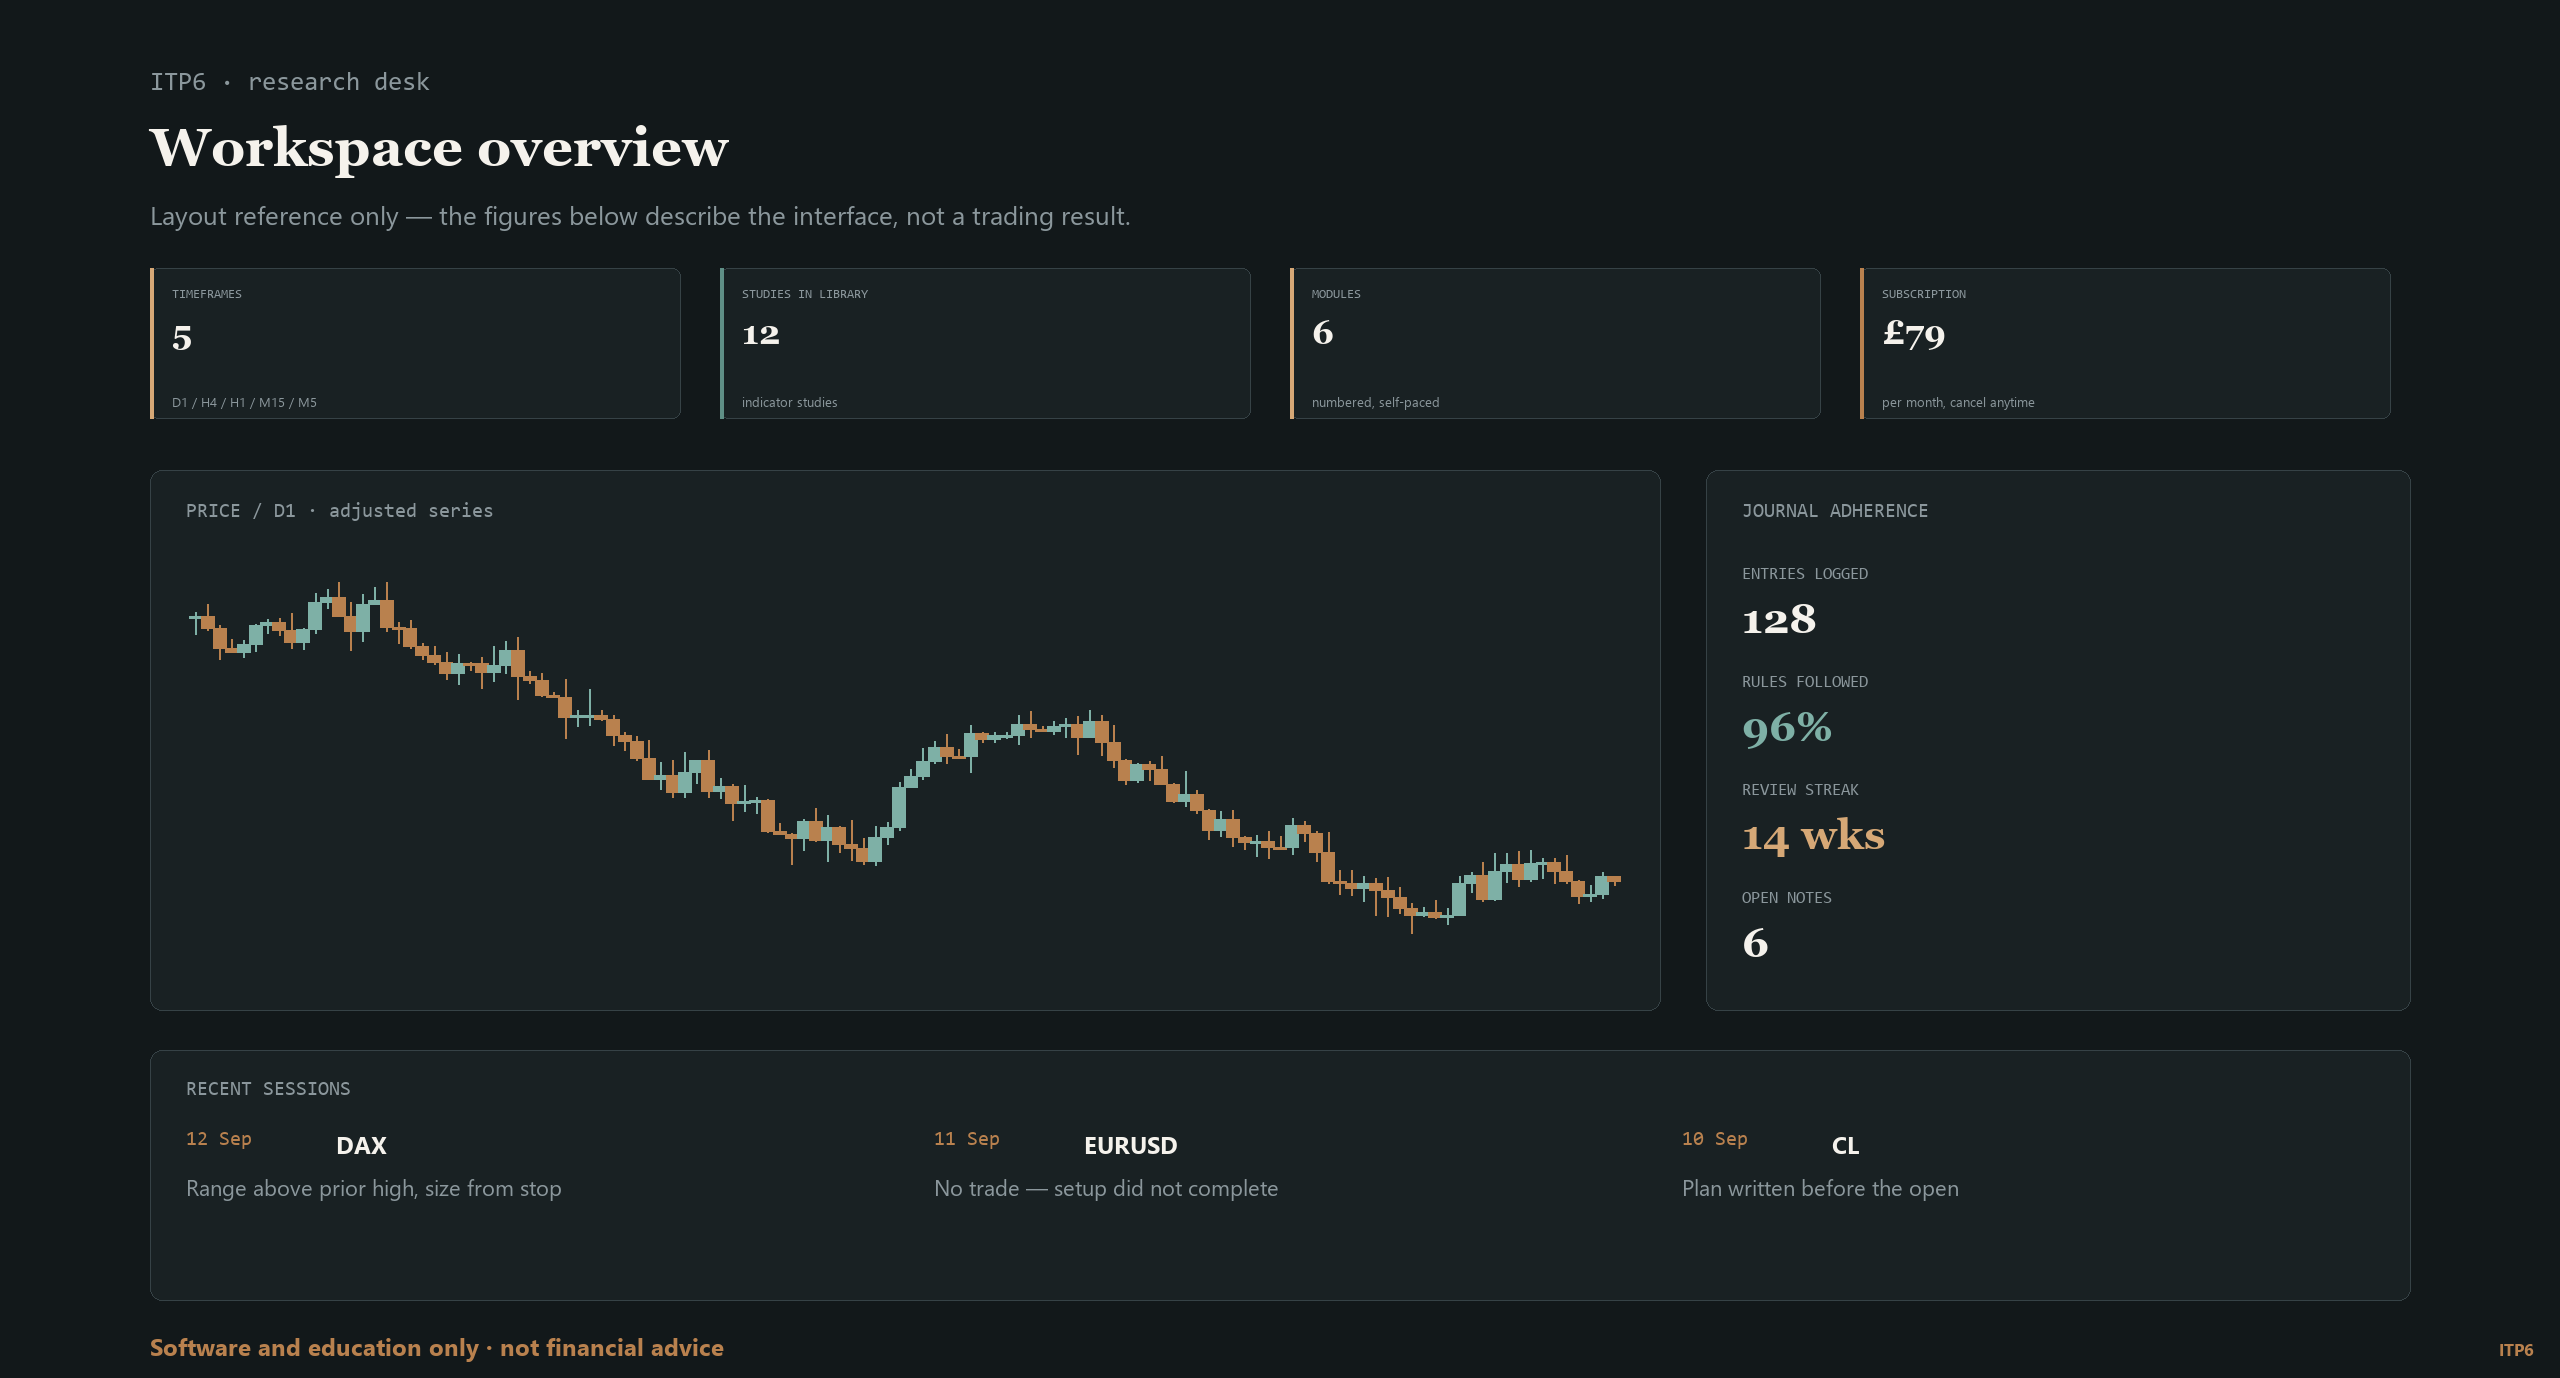
Structured entries with tags, screenshots and a rule-adherence score you compute against your own written plan.
- Free tags with saved tag sets
- Screenshot attached to each entry
- Rule-adherence scoring out of 100
- Weekly review export as CSV or PDF
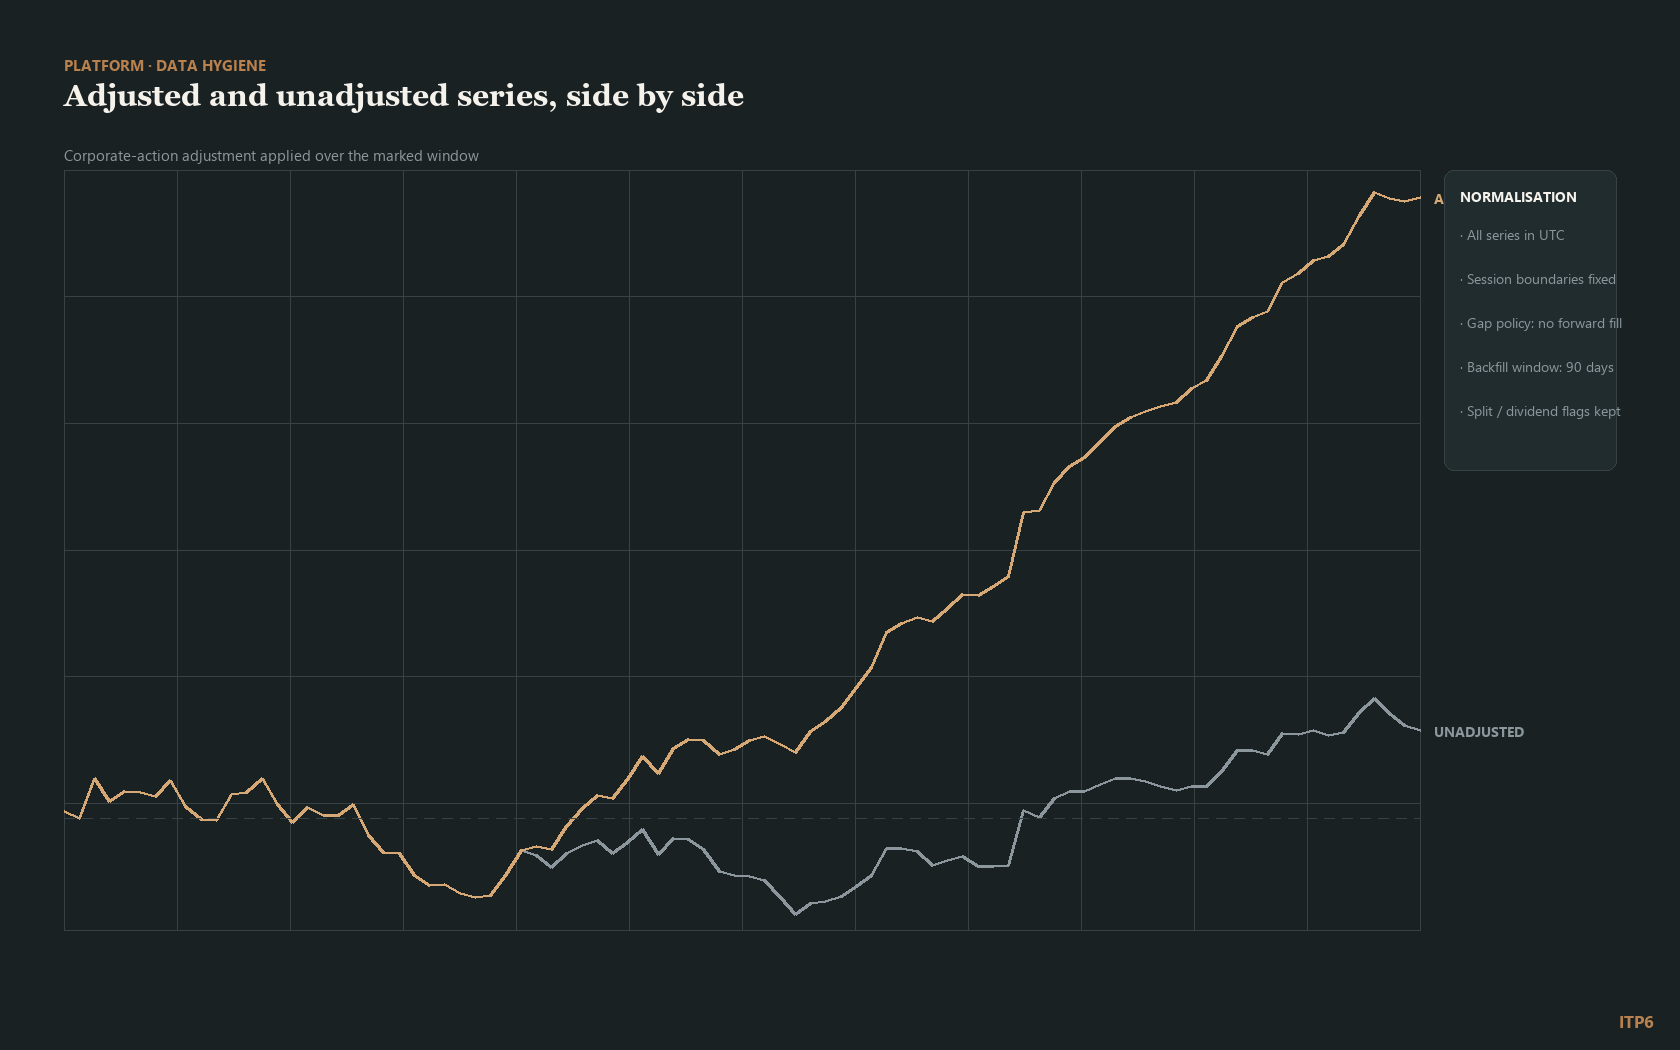
Data Hygiene
What sits behind a price series: adjustment, timezone normalisation, gap handling and the backfill policy.
- Adjusted and unadjusted series side by side
- Everything normalised to UTC
- Gap policy with no forward filling
- Split and dividend flags retained
Product tour
Three views of the same company
Pick a tab. Nothing here needs a sales call, and nothing is hidden behind one.
The charting side
- Price panel with saved zone sets and four timeframe groups
- Twelve studies across trend, momentum and volatility
- Multi-timeframe alerts on structure conditions you define
- Layout saved to the account and restored on any device
A demo session walks through the workspace against the sample dataset before you commit to a tier.
The learning side
- Six modules, from price structure through to data hygiene
- Four practice datasets with documented provenance
- A journal template with tag sets and adherence scoring
- Worked examples you can reproduce line by line
Written for people who want the arithmetic shown, not summarised.
The research side
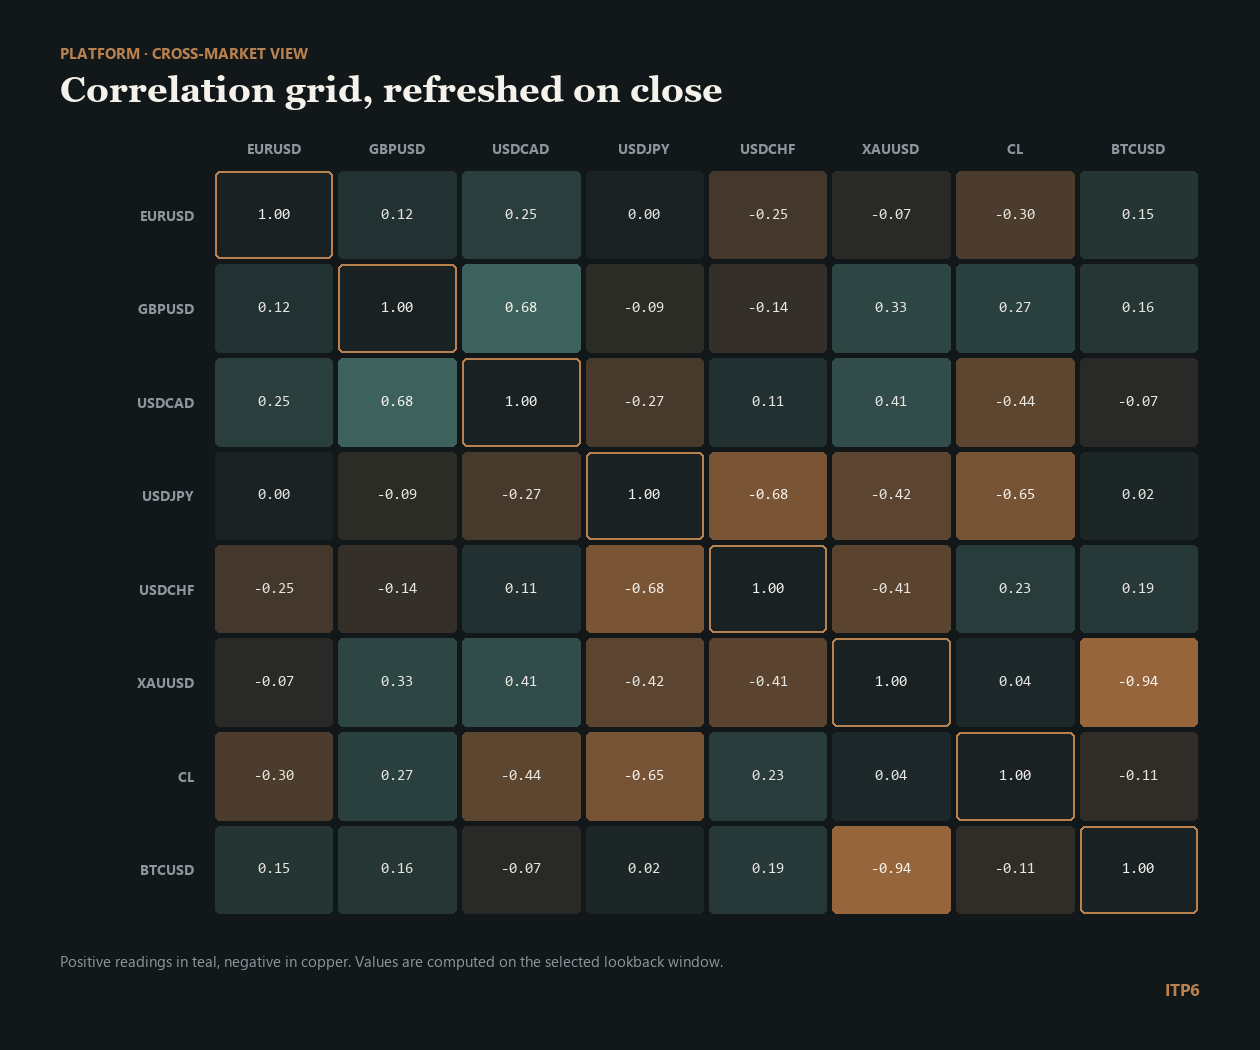
- Cross-market correlation grid, refreshed on the close
- Session coverage and overlap diagnostics
- Dataset notes covering adjustment and backfill decisions
- Export to CSV for whatever tool you already use
Outputs describe the data. They do not describe what to do with it.
Getting started
From subscription to a written routine, in four steps
Choose a tier
Observer and Analyst cover the software alone. Practitioner adds every module and the dataset pack.
Open the workspace
Your layout, watchlist and saved zones are waiting. Nothing needs installing beyond a browser.
Work through module 01
Price structure first. It is the module every other one assumes you have read.
Journal and review
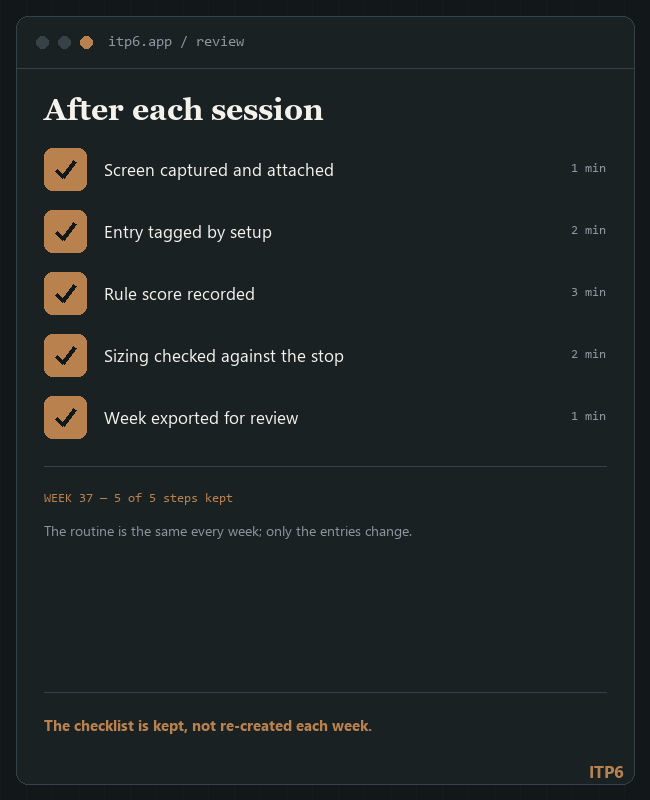
Tag each entry, score it against your own rules, and export the week for review.
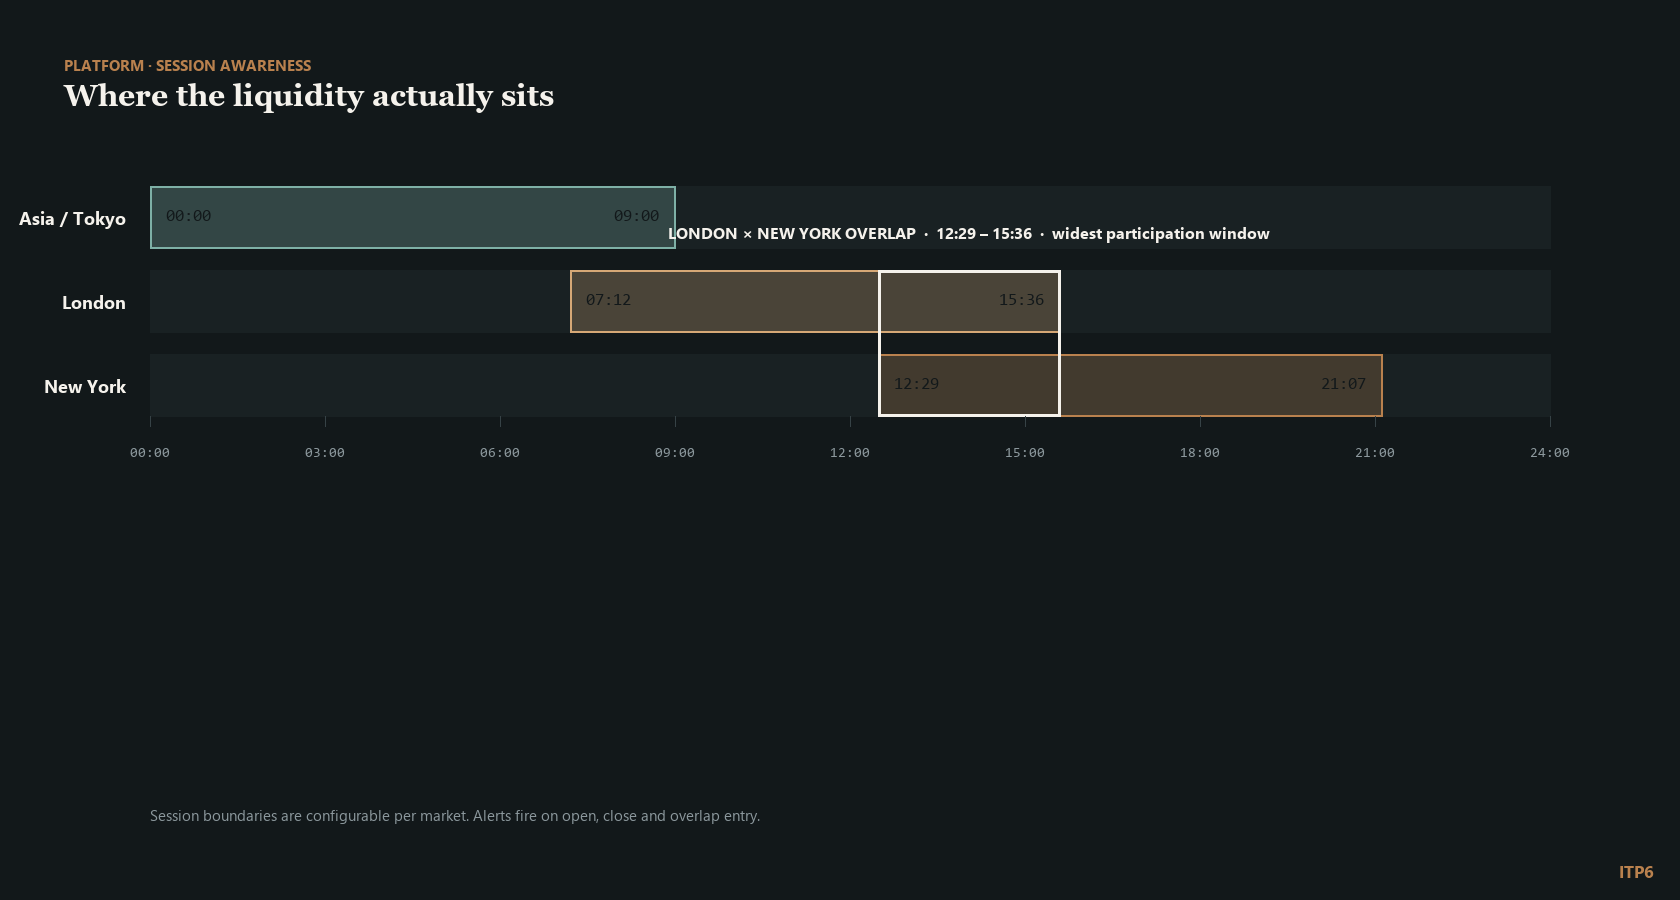
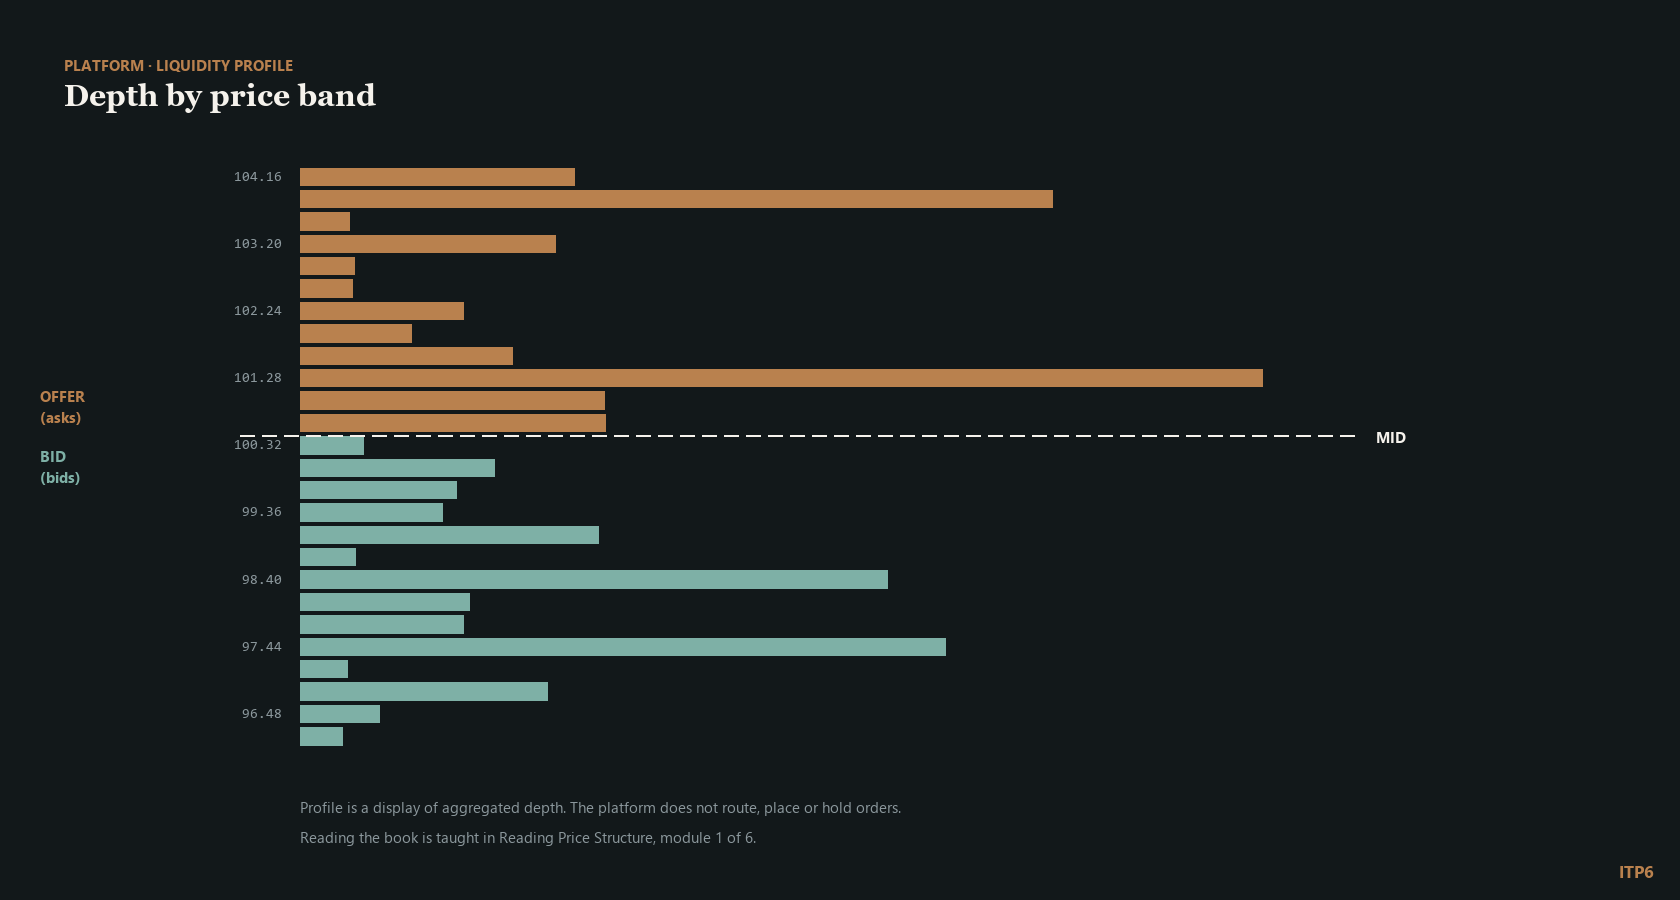
Sessions, and where liquidity actually sits
Session boundaries are configurable per market. Charts and alerts respect them, so an instrument is never read against a session in which it does not trade.
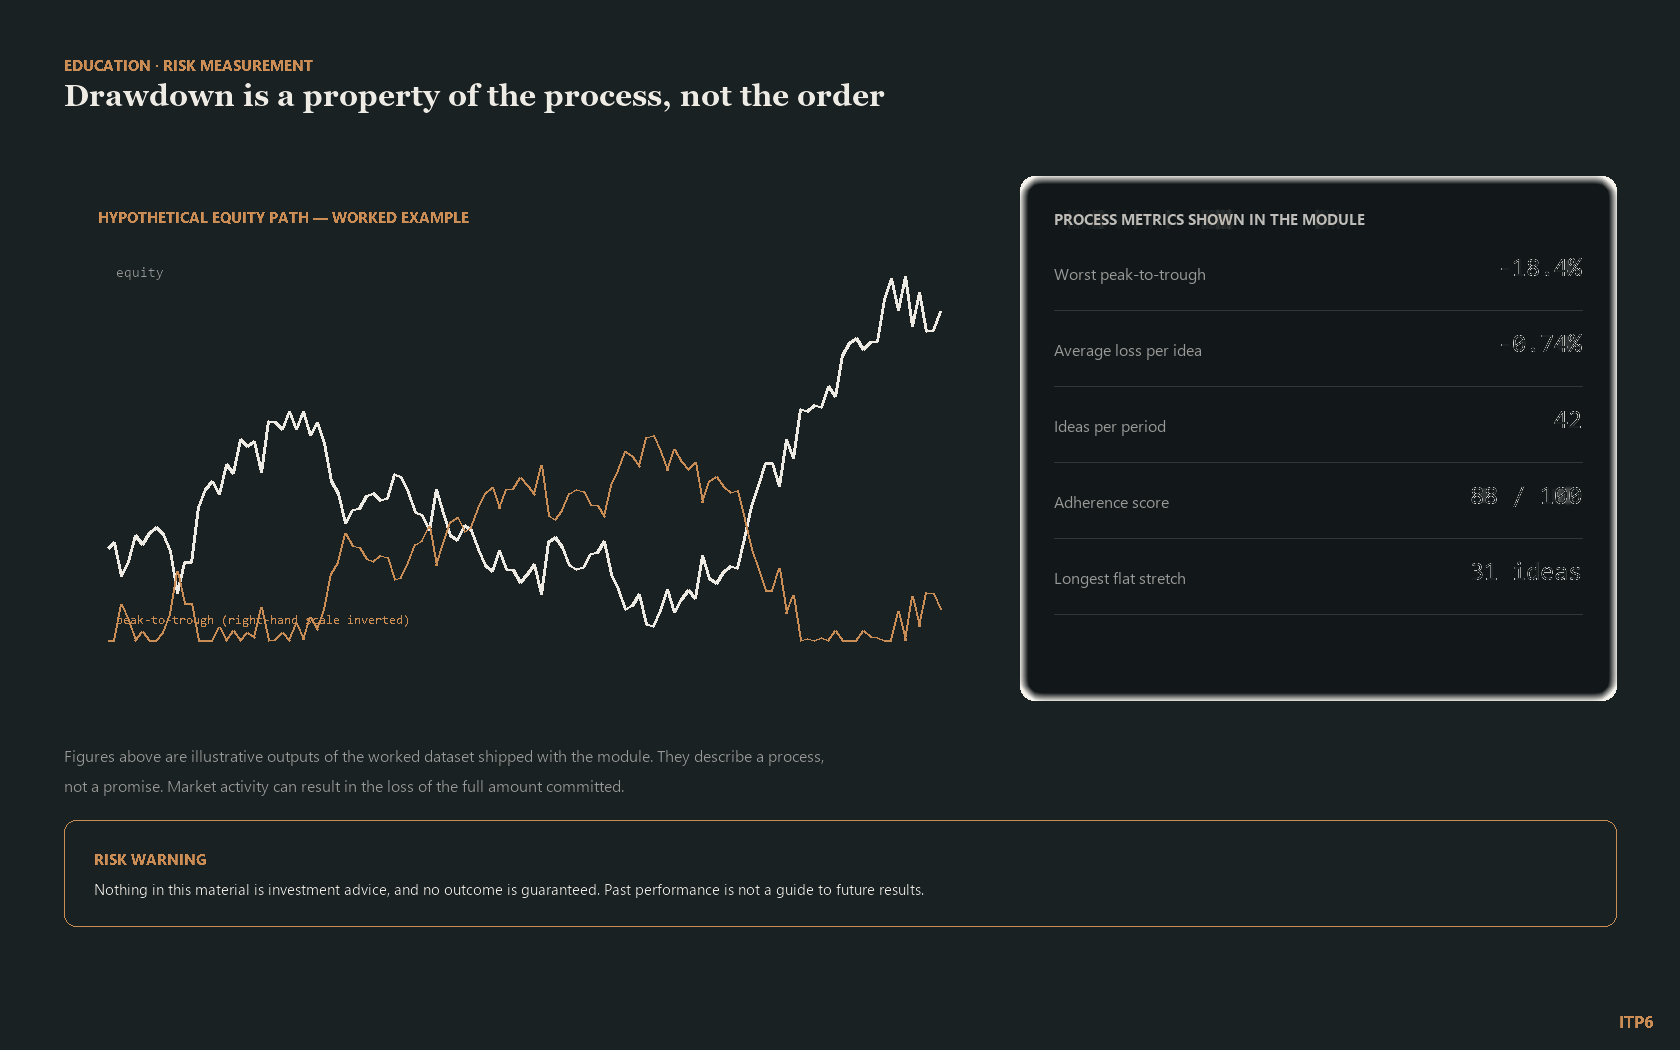
Risk measured as a process, not a promise
The risk module shows drawdown, average loss per idea and adherence scoring against the worked dataset. It explains the arithmetic. It does not predict an outcome.
Practice data
Four datasets, documented from source to chart
Every dataset ships with notes on adjustment, timezone handling and the backfill window, so a worked example can be reproduced rather than taken on trust.
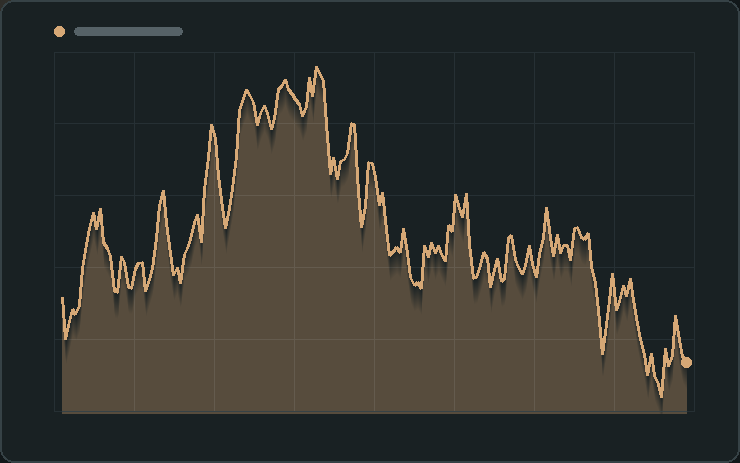
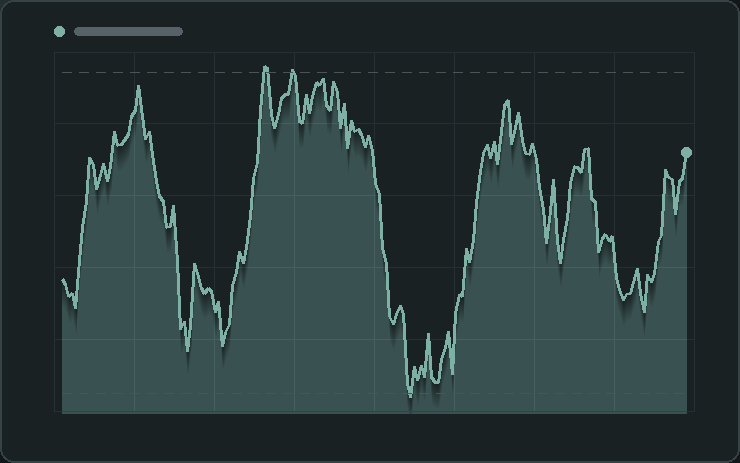
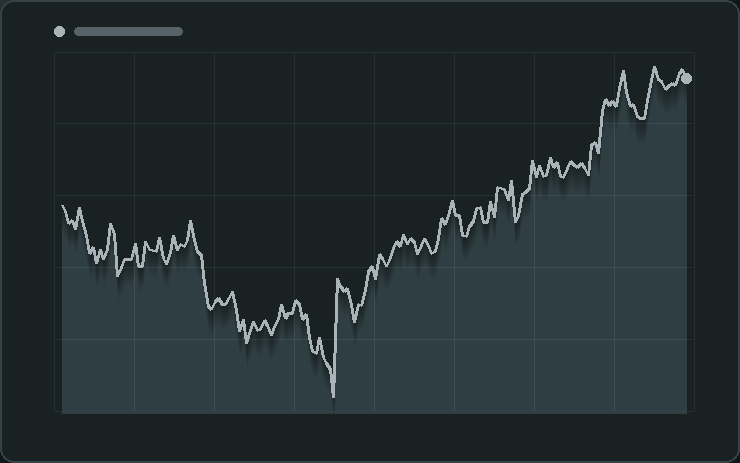
The fourth dataset is released with each quarterly content drop and is available to Practitioner and Desk subscribers.
Subscriptions
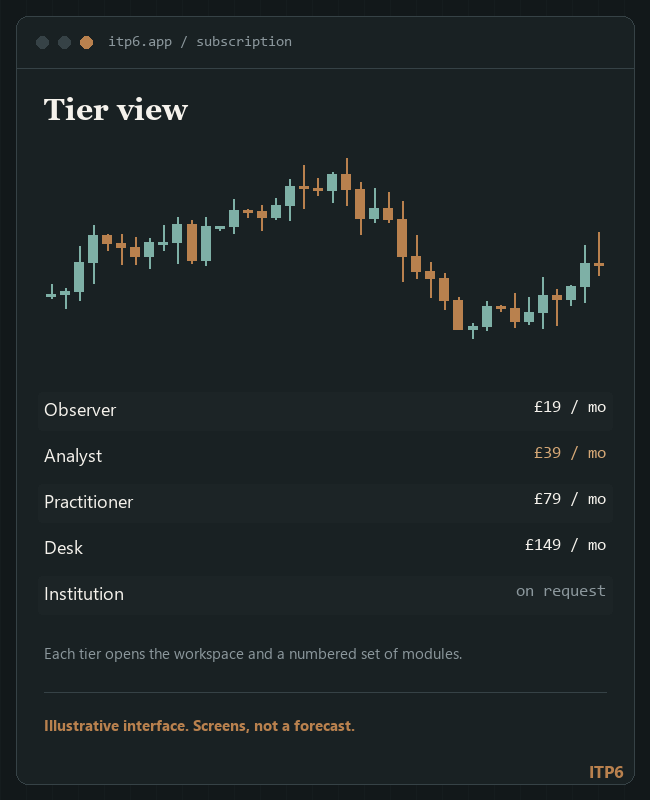
Four tiers, and one we price on request
Every tier is software and education. There is no advisory product above them and no managed service beside them.
- Platform read-only access and two of the six modules.
- Full indicator library, journaling and four modules.
- All six modules, multi-timeframe alerts and the dataset pack.
- Five seats, priority support and a quarterly content drop.
Institution — onboarding, single sign-on and invoicing arranged to your procurement process. Price on request.
See the workspace before you subscribe
A demo session runs against the sample dataset and takes about twenty minutes. You will see the charting, the journal and the data notes — and you will see what the platform deliberately will not do.
Risk warning. Market activity carries the risk of loss, including the loss of the full amount committed. Past performance is not a guide to future results.
No investment advice. ITP6 Ltd publishes software and educational material for educational purposes only. Nothing on this website is investment advice, a personal recommendation, or an offer to arrange any transaction in any financial instrument.